Cloud Database Consultant, Didgenet
When I was an Oracle Enterprise Manager SME working in Oracle Corporation some
years ago, I had wished that the product would work with multiple database
engines in the same superb way that it worked with Oracle databases. That never
happened, but I was pleasantly surprised recently to find a brand-new cloud-based
product was promising exactly that, and delivering it as well – a fully-managed,
high-performance DBaaS (Database as a Service) for your choice of database engine
– whether it be Oracle, MS SQL Server, MySQL, or PostgreSQL – and on your
choice of cloud, whether it be AWS or Azure. Interested, I knew I had to take a
further look.
I found that the same USA-based Enterprise Manager experts
that had made it such a great tool for on-premise Oracle databases, had gone
ahead and created Tessell – a company with which Didgenet, an Australian Indigenous
majority owned business has recently partnered with in our part of the world.
What this DBaaS product promises is a uniform and seamless
experience for "any database on any cloud". The list of databases and
clouds it supports is certainly going to expand, as per my talks with the
founders. It also fills a gap by providing a fully-managed database service for
Oracle and other database engines on Azure. There is a choice of deployment for
the data plane – it can be hosted and fully managed by the product provider in
their own cloud data infrastructure account, or hosted at the customer cloud
infrastructure account, and fully managed in that case as well. So, as an
example, let’s take a closer look at how it handles Oracle databases on Azure.
Multi-Availability Zone – High Availability (HA), and cross-region Disaster
Recovery (DR) services are provided out-of-the-box, and this means that the
product can easily deliver seven nines availability for mission-critical Oracle
databases. And what about performance? If so required, high-performance Azure
compute infrastructure such as Lsv3 with directly attached NVMe
storage can be selected for mission-critical Oracle databases, to
deliver up to 2 million IOPs with low latency. About the capacity, it can be large
enough to suit your needs - up to 96 vCPUs, 768 GiB RAM, and 60 TB storage. For
other Oracle databases with normal performance requirements, standard
infrastructure such as Azure VMs and premium disks can be used.
The other benefit of a fully managed database service is that DBA time for
day-to-day activities is considerably reduced. This is something close to my
heart, having been a DBA since the 1990s. I always wanted to reduce or automate
tedious manual DBA tasks, finish work and go home early (in the days before
work from home). And this product will help. The DBaaS data plane provides an “Availability
machine” that executes regular automated snapshots (minimum of 1 per day) and Oracle
archive log backups (every 5 minutes), with 1-click recovery available to the
DBA to recover a database up to the last committed transaction, or perform a
point-in-time recovery, or recover from a snapshot of the database. Redo logs
are multiplexed by default. This type of data protection and data availability
allows zero data loss. Even logical backups (Oracle export dumps) used by many
Oracle customers, can be created with a few clicks.
Database Patching is also an important DBA activity, and in
this case patches for minor version upgrades are applied automatically. The DBA
can select the patch version to apply, and then schedule patching, or patch
straight away.
Importantly, the Availability Machine also enables masking, sanitization, and
cloning of such data. Not many products do that. Data access policies can be
created so that masked data can be securely shared with non-production
environments such as development or UAT.
This is very important to protect personal confidential information in
databases from data leaks in today’s day and age. As a matter of fact, some of
my friends have been the victims of recent leaks, and this could have been
avoided if masking of data had been enforced for UAT testing and development in
the service provider where their personal confidential information was stored.
The DBaaS product can be used out-of-the-box, but is also
flexible enough to allow customization in various aspects. You can bring your
own software images, database parameters, keys, network and security settings,
cloud account, licenses and even identity providers. And your existing
databases, whether on-premise or on the cloud, self-managed or managed by
another provider, can be migrated to the DBaaS data plane using the migration
services provided by the company or partner.
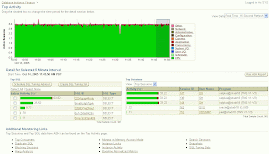
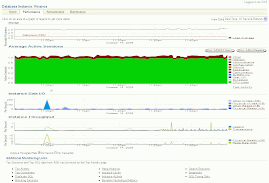
Monitoring and Log visibility is out of the box. What I also
understood was that the DBaaS product can be integrated with third-party
software and services for observability, security/compliance, and data pipelines
– including Oracle Enterprise Manager, Azure Monitor, Datadog, Splunk and
others.
All that certainly makes Tessell worth looking
into, and it looks like partner Didgenet is ready to help in Australia.