We are discussing the management of Oracle Database 12c in Oracle Enterprise Manager 12c. In our previous blog post on this topic, we were exploring the Activity tab in the Performance Hub of Enterprise Manager Database Express 12c. Let us move to the Monitored SQL Tab.
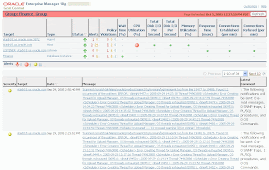
This is the Real-time SQL Monitoring feature of the Diagnostics pack. This screen shows all the long running SQL statements (that have consumed 5 seconds or more of combined CPU and I/O time in a single execution, or are using parallel query).
Ever wondered why that report was taking so long? It is possible to drill down and see the plan steps executing for the SQL statement, as can be seen in the following screenshot. This helps considerably in analyzing long-running SQL statements.
The next two tabs of the Performance Hub show ADDM (Automatic Database Diagnostics Monitor) and its results, including Real-time ADDM which was previously used for emergency database issues, but now runs proactively to catch database issues before they cause a real problem.
For example, the following real-time ADDM report shows library cache contention, and the “Show Reasons” button suggests that the system is CPU bound.
Real-time ADDM runs in the database automatically every 3 seconds, and in this way is able to detect transient performance issues. The performance data in memory is examined, and any performance spikes are detected. The administrator is then informed of the spike and its root cause.
This blog post was originally published at this link.




No comments:
Post a Comment